Natural Resources

This blog published some information & articles about hydroclimatology,desert and flood

My Photo
Name:
Location: Tehran, Tehran, Iran

I am a Ph.D researcher in field of hydrology , desert & desertification.

Saturday, July 05, 2008

SHELTERBELTS FOR FARMLAND-(3)

3.2 Ventilating wind coefficient
3.2.1 Concept and calculating method
When wind direction is vertical to a forestbelt, a ratio which is about a average wind speed under places of a forestbelt height at leeward of forestbelt fringe to a average wind speed under the same height in wildness is called ventilating wind coefficient, d0 stands for the ratio; “U” stands for a average wind speed in time, “[U]”stands for a average count of U in space, so a formula is following:
(1/H∫0HU(z)dz) [U]
d0 = =
(1/H∫0HU0(z)dz) [U0]

In this formula U (z) stands for a average wind speed at forest fringe in leeward forestbelt, U0(z) stands for a average wind speed in wildness, both of them are function of height “z”.

Practically, like the density of penetrating sunshine spaces, average wind speeds of 3-5 height instead of average wind speed U(z) in time and space. Individually, d1, d2, d3 stand for ventilating wind coefficient of upper layer, middle layer and lower layer of a forestbelt, A, B and C respectively, stands for thickness of every forest layer, H stands for the average height of a forest belt. The ventilating wind coefficient can be attained with the formula:
d0 = (d1* A + d2* B + d3*C )/H

3.2.2 The ventilating wind coefficient, forestbelt structure and windbreak effect
The ventilating wind coefficient is an important parameter. Usually, it is as an index to judge merit and demand a forestbelt structure. The relation between the ventilating wind coefficient and windbreak effect is similar to the density of penetrating sunshine spaces.

In north China, the best ventilating wind coefficient of shelterbelts for farmland is 0.5-0.6.

3.3 Forestbelt width
Many experiments and practices in China and in former Soviet Union show that windbreak effect is influenced by forestbelt widths. When the ratio of a forestbelt width to height are smaller, the influence isn't too clear. However, a ratio about width of a forestbelt to height of forestbelt ³5, the influence occurs clear. When there is a proper density of penetrating sunshine spaces (or ventilating wind coefficient), a forest width can be adjusted in a big scale. A better windbreak effect can be got from several lines to tens of lines. Shelterbelts for farmland in the west area of northeast China are generally adapted 6-12 lines. Width is 9-18m, in Xinjiang area is often planted 4-8 line, width is 6-12m. A better windbreak effect is gained; Hexi area of Gansu province is 2-4 lines, 3-6m wide. Of course, the narrower the forestbelts and also the shorter the distance between forestbelts, the better are the protective effect.

3.4 Forestbelt height
Generally, an absolute value of windbreak distance of forestbelts becomes bigger with increasing of forestbelt height, and is direct ratio. So, the forestbelt designing should select some high tree species. Effective windbreak distance of forestbelts is often expressed by multiples of tree height (for example 20H, it is 20 times of forestbelt height). Forestbelt height doesn't have a clear influence on relative value for forestbelt protective distance.

3.5 Forestbelt cross section

Table 2: Windbreak effect of cross-section forms of forestbelts
Single line density of penetrating sun shine spaces on cross section
Lines
Sheltered distance(H)
decreasing Percentage of wind speed(%)

When shelterbelts for farmland are planted, because of differences in tree species and planting patterns of arrangement, they form some different cross section shapes of forestbelts. Common shapes are rectangle, triangle (equilateral or inequilateral triangle), ridge (symmetry or no symmetry), trapezoid, cancavity, etc. When other features of a forestbelt are the same, cross-section forms of a forestbelt are not the same; windbreak effectiveness has more differences obviously. Chinese scientist, Prof. Cao Xinsun, used bamboo material with heights of 1-1.8m and diameter of 2cm. 24 bamboo was planted per meter, 5 kind of forestbelt models of 7 lines was made, and the data are obtained on windbreak experiments (table 2).

On comparison of result of five different cross sections, the rectangle was founded to be the best, not only in decreasing average wind speed, but also in increasing windbreak distance. Second, is cancavity form. Finally, we can get a result in cross section forms about forestbelts; the rectangle is the best one.

Saturday, June 28, 2008

SHELTERBELTS FOR FARMLAND-(2)

3 Windbreak effects and structure features of forestbelts

Windbreak effect and structure features of forestbelts have close relationship. The main structure features, which influence windbreak effect of forestbelts, include density of penetrating sunshine spaces, ventilating wind coefficient, width of forestbelt, height of forestbelt, cross-section of forestbelt shapes, and conditions for having leaves or no leaves, etc.

3.1 Density of penetrating sunshine spaces
3.1.1 Concept and calculation ways
It is a ratio of projection area of penetrating sunshine spaces on vertical section of a forestbelt “s’” to total projection area on vertical section of a forestbelt “s”, (express by fraction or percentage), b stands for density of penetrating sunshine spaces.
b = s’/s×100%
In order to be accurate, b can also be counted by forest layers weighted average, such as b1, b2, b3, stand for the density of penetrating sunshine spaces of upper, middle and lower forest layers, individually, A, B, C stand for the thickness of forest layers. H stands for an average height of a forestbelt. The result can be attained with following formula.
b =(b1*A + b2*B +b3*C)/ H

3.1.2 Measure methods
We can use eye measurement, rectangular spectacle, taking Photograph, Probability analysis methods to measure the density of penetrating sunshine spaces of a forestbelt (the detail of measurement is omitted).

3.1.3 Density of penetrating sunshine spaces and the structures of forestbelts
The density of penetrating sunshine spaces is an important feature in the forestbelt structure., Hukumun.P. and KRHLGA.C. A in former Soviet Union have counted and defined the scale for fundamental structure types about density of penetrating sunshine spaces (table 1).

Table 1:The relationship between forestbelt structure type and density of penetrating sunshine spaces
structure types
density of penetrating sunshine spaces(%)
among trucks
among crowns
Dense
Sparse
ventilating
0-10
15-35
>60
0-10
15-35
0-10

This kind of division has a lot of advantages which indexes are clear, and easily to distinguish, certainly, we think that the best method is first to judge a fundamental structure by eyes, then, to distinguish it with density of penetrating sunshine spaces. For instance, a sparse forest belt has 0.3 of density of penetrating sunshine spaces. A sparse forest has 0.4 of density of penetrating sunshine spaces. A ventilating forest belt has 0.5 of density of penetrating sunshine spaces. A ventilating forestbelt has 0.7 of density of penetrating sunshine spaces. And so on.

3.1.4 The relation between density of penetrating sunshine spaces and sheltered effect
The density of penetrating sunshine spaces has close relationship with windbreak effect. Many experiments of scholars had shown, at first, effective protective distance of forest belt increases with increasing the density of penetrating sunshine spaces. When density of penetrating sunshine spaces reaches a certain point, meanwhile, the protective distance reaches the maximum; then, with the density of penetrating sunshine spaces increases continuously, however, the effective protective distance decreases. In north China, practices in production show that the most suitable structure of shelterbelts for farmland is narrow forestbelts, which have 0.25-0.3 of density of penetrating sunshine spaces. This kind of forestbelt not only has the most protective result, but also occupies smaller farmland.

Wednesday, June 18, 2008

SHELTERBELTS FOR FARMLAND-(1)

Man. Doqing
Ganzhu desert control Research Institute,Wuwei,China

1 -The concept of shelterbelts for farmland and their purpose
1.1 Definition
An artificial forest comprising of belts to protect farmland is called shelterbelt for farmland.
In addition, all shelterbelts, which are planted along the roads in farmland, riverbanks, ditches and the fringes of deserts close to the farmland, are also included in the same category.
Each shelterbelt for farmland is called a protective forestbelt, or a forest belt. The forest belts, which crisscross each other, are called networks of shelterbelts for farmland or networks of forests.
1.2 The purpose of the shelterbelts for farmland
The main purpose of the shelterbelts for farmland is to protect farming crops from natural disasters, particularly from the meteorological disasters, and to improve the farming eco-environmental conditions.
Along the desert fringes or moving dunes in oasis. The establishment of shelterbelts for farmland not only declines blownsand encroachment, such as, sand beating, cutting and piling in the farmland, but also forms a oasis shelterbelt system to improve the quality of the whole environment and to increase the productivity in the oases.
In recent years, people in China have been developing ecological agriculture and farming systems. On the whole, it is a kind of integrated utilization of plants in different space and time. It is on the basis of making fully to utilize sunshine, energy, farmland, labor and living beings to link with planting, raising, woods-fruit and manufacturing industry altogether. This can increase the agricultural benefit several times than the single planting trade. In the ecological agriculture, shelterbelts not only have a protecting function, but also provide a great economic benefit. So it is a protector, and in the same time is also a producer. In the future, with the development of technology of shelterbelts for farmland, the process which people set up shelterbelts for farmland is, in other words, the process that people establish integrated and sustainable agro-eco- systems is.

2. The structure of shelterbelts


2.1 Concept
The structure of forestbelts is size, amount and distribution of wind penetrating gaps in the forestbelt, that is, the distribution and the density of the branches and leaves of the trees.
The different structural forestbelts because of their differences in tree species, their penetrating sunshine space positions and distribution of each part of trees in the air, form some special external shapes. From vertical section of a forestbelt, through penetrating sunshine spaces and their distributions, evenness and layers of a forestbelt can be observed. From cross section of a forestbelt, the various geometric can be seen. These special features determine the function of ventilating condition and windbreak effect of a forestbelt.
The density of plantation (spacing in the rows and rowspacings), the width of a forestbelt (the number of rows) and the disposing patterns of tree species are the main factors of the forestbelt structure.

2.2 Fundamental types of forestbelt structure
According to the big or small ones and distribution of penetrating sunshine space, and windbreak features, the forestbelts are usually divided into three types; they are dense structure, sparse structure and ventilating structure.
2.2.1 The dense structure
The branches and leaves of the trees in the tree belt are crisscross each other during the growing period, the forestbelt is just like a wall and hardly has penetrating sunshine spaces. When the medium wind blows to the belt, it can hardly pass through. The most part of the air current (or airflow) passes from the top of the forestbelt and forms a wind free area or a weak wind area in the leeward of forestbelt fringe. After the air current gets over the forestbelt, the wind speed recovers to the initial speed soon. So the belt with the dense structure has a short protected distance.
Generally, the wide forestbelt which has many rows and three layer crowns to be formed by trees, sub-trees and shrubs in the same forestbelt is the dense structural forestbelt. Some narrow dense forestbelts, branchy trees, or fruticous community in which trees or bushes had been cut to form branchy densely form, also belong to the dense structural forestbelts.

2.2.2 Sparse structure
The penetrating sunshine spaces are evenly distributed on the vertical section. The wind, which blows to it, is divided into two parts, one part penetrates it, just like through a sifter, and forms many small vortex flows at the leeward of the forestbelt, another part goes over on the top of the forestbelt. So a weak wind area is formed at the leeward of forestbelt fringe. The farther the distance to the forestbelt is, the stronger the wind speed recovers. This kind of structure has a longer protective distance.
Usually, the forestbelt, which has two layers of forest-crowns, formed by trees and shrubs can form the sparse structure, or the forest, which has no shrubs, but the branchy trees can also form the sparse structure, too.


2.2.3 Ventilating structure
According to the distribution of penetrating sunshine spaces, this kind of structure has obvious two layers. One layer of tree crowns has smaller and evenly penetrating sun shine spaces, or has hardly penetrating sunshine spaces; another layer (underneath) of trunks has bigger paling-like penetrating sunshine spaces. When the wind blows to the forestbelt, one part goes over the top of the crown layer; another part passes through the underneath, because of Venturi effect, its speed in forestbelt is sometimes higher than that of the wildness. The wind begins to spread at the forest fringe of the leeward and becomes weak gradually; a weak wind area will form at a longer distance from the forestbelt. This distance is called mixed length. After this, the wind speed will be recovered gradually. So protected distance is longer.
Usually, the narrow forestbelt which are only comprised by trees, without shrubs or just with low shrubs in it, and which have evident clear height under the branches and leaves can form the ventilating structure.
Besides above three basic types, practically, there are many transitional types of these forestbelts, such as, upper layer sparse-lower layer dense structure, or upper layer dense-lower layer sparse structure, and etc.
....contineu.....

Sunday, May 11, 2008

Determination of geographical domain of Iran deserts

abstract

In order to recognize and mapping domains of the real deserts, it is needed to gather a fermendous data and information regarding environmental parameters such as Geology, Geomorphology, Climatology, Hydrology, Pedology and Vegetation cover. In fact these environmental parameters and their interaction effects lead to form and develop the real deserts. Thus in this research we try to study the most specification of desert to seek these processes based on related sciences. After determination of desert boundaries, the degree of contribution or segregation of each individual desert unit were recognized and mapped digitally using Geographical Information System (GIS).finally based on the executive instruction of this project after recognition of the natural desert units in the country map with utilization of the coordinate system of Iran's map georeferences and control check point all natural desert units were set up on the whole country map.
Individual investigation of deserts due to environmental parameters indicated the climatic deserts and vegetation cover feature have the maximum area respectively (706672&600467 km2), while geologic and geomorphologic deserts have the minimum area respectively (208041 & 287316 km2). Crossing and matching of different layers showed that each individual layers covers different desert area on the map. Thus, if climatic parameters are used to determine desert area only 42.9% of Iran is accounted, while if the geologic parameters are used, 12.6% of Iran is known as a desert. The common parts of overlaying all parameters were selected as a true desert, in this case the whole areas which known as true deserts are 16.9% of Iran map (278513 km2). In this area vital resources are limited seriously by harsh conditions such as evaporate formations, low precipitation, together with high evaporation and temperature.

Key word: Desert, Geology, Geomorphology, Climatology, Hydrology, Pedology, vegetation cover. GIS, Iran.

Saturday, March 03, 2007

Paradox of Our Times

* Today we have bigger houses and smaller families; more conveniences, but less time;
* we have more degrees, but less common sense; more knowledge, but less judgment;

* We have more experts, but more problems; more medicine, but less wellness.* We spend too recklessly, laugh too little, drive too fast, get to angry too quickly, stay up too late, get up too tired, read too little, watch TV too often, and pray too seldom.* We have multiplied our possessions, but reduced our values. We talk too much, love too little and lie too often.
* We‘ve learned how to make a living, but not a life; we’ve added years to life, not life to years.
* We have taller buildings, but shorter tempers; wider freeways, but narrower viewpoints.
* We spend more, but have less; we buy more, but enjoy it less.
* We've been all the way to the moon and back, but have trouble crossing the street to meet the new neighbor.
* We've conquered outer space, but not inner space. We've split the atom, but not our prejudice;
* We've learned to rush, but not to wait; we have higher incomes, but lower morals.
* We build more computers to hold more information, to produce more copies, but have less communication. We are long on quantity, but short on quality.

* These are the times of fast foods and slow digestion; tall men and short character; steep profits and shallow relationships.
* More leisure and less fun; more kinds of food, but less nutrition; two incomes, but more divorce; fancier houses, but broken homes.* That’s why I propose, that as of today, you do not keep anything for a special occasion, because every day that you live is a special occasion.
* Search for knowledge, read more, sit on your front porch and admire the view without paying attention to your needs.
* Spend more time with your family and friends, eat your favorite foods, and visit the places you love.
* Life is a chain of moment of enjoyment, not only about survival.
* Use your crystal goblets. Do not save your best perfume, and use it every time you feel you want it.
* Remove from your vocabulary phrases like “one of these days” and “someday”. Let’s write that letter we thought of writing “one of these days”. * Let’s tell our families and friends how much we love them. Do not delay anything that adds laughter and joy to your life. * Every day, every hour, and every minute is special. And you don’t know if it will be your last.
* If you’re too busy to take the time to send this message to someone you love, and you tell yourself you will send it “one of these days “. Just think…”One of these days “, you may not be here to send it!

Tuesday, November 14, 2006

Investigation of effects of land cover and climate change on river flow (Case study: Minab watershed)

Barkhordary Jalal khosroshahi Mohammad

ABSTRACT:

This is illustrated by frequent occurrences of severe droughts and floods. The challenge is to determine whether these hydrological hazards and disasters are the result of climatologic variability or of man-induced changes. This study provides an alternative approach to assess the actual changes in hydrologic response of a watershed in an arid tropical region to land use transformations made in the past 25 years. The approach combines remotely sensed image data from satellites with in-situ hydrological observations from the Minab catchment's (ca. 1.106 ha). Results of long-term analysis of historical time series on rainfall, land use and stream flow are integrated at the landscape level, to identify appropriate options for land and water management. In 1976, about 45 percent of the watershed area was covered by rangeland and natural forest. Due to continued overgrazing, rangeland cover decreased to 8 percent in 2002. Three main land use classes have replaced these fertile rangelands. These are: poor natural cover, agricultural area and residential area. The destruction of natural vegetation resulted in a decrease of the annual total water yield by 3.4 mm, with a decrease in the base flow during the low-flow period (May-November) and an increase in the storm runoff during the high-flow period (December to April). It can be concluded that climatic variability and land use change are the most important factors affecting the (changes in the) hydrologic regime of the Minab catchment's. For a flood return period of more than 10 years, (high) rainfall intensity as a climatic factor is considered dominant. For a return period of less than 10 years in combination with a low flow period, land use change is the dominant factor determining the flow regime. An active management strategy aimed at the conservation and regeneration of the natural vegetation is recommended, in order to improve the distribution of water throughout the entire Minab catchment's, during both dry and wet periods.

Keywords: Land cover change, climatic variability, catchment hydrology, remote sensing, GIS

Investigation of effects of land cover and climate change on river flow

(Case study: Minab watershed)
Barkhordary Jalal khosroshahi Mohammad

ABSTRACT:

This is illustrated by frequent occurrences of severe droughts and floods. The challenge is to determine whether these hydrological hazards and disasters are the result of climatologic variability or of man-induced changes. This study provides an alternative approach to assess the actual changes in hydrologic response of a watershed in an arid tropical region to land use transformations made in the past 25 years. The approach combines remotely sensed image data from satellites with in-situ hydrological observations from the Minab catchment's (ca. 1.106 ha). Results of long-term analysis of historical time series on rainfall, land use and stream flow are integrated at the landscape level, to identify appropriate options for land and water management. In 1976, about 45 percent of the watershed area was covered by rangeland and natural forest. Due to continued overgrazing, rangeland cover decreased to 8 percent in 2002. Three main land use classes have replaced these fertile rangelands. These are: poor natural cover, agricultural area and residential area. The destruction of natural vegetation resulted in a decrease of the annual total water yield by 3.4 mm, with a decrease in the base flow during the low-flow period (May-November) and an increase in the storm runoff during the high-flow period (December to April). It can be concluded that climatic variability and land use change are the most important factors affecting the (changes in the) hydrologic regime of the Minab catchment's. For a flood return period of more than 10 years, (high) rainfall intensity as a climatic factor is considered dominant. For a return period of less than 10 years in combination with a low flow period, land use change is the dominant factor determining the flow regime. An active management strategy aimed at the conservation and regeneration of the natural vegetation is recommended, in order to improve the distribution of water throughout the entire Minab catchment's, during both dry and wet periods.

Keywords: Land cover change, climatic variability, catchment hydrology, remote sensing, GIS

Tuesday, September 19, 2006

Spatial priority of flood potential areas

Although flood damages normally concentrated along certain reaches of the main watercourse, but the contribution of tributary subwatersheds to the flood effects at downstream should not be overlooked. This research present a methodology, based on the use of mathematical hydrologic models simulating mutual interaction of effective factors, to study the spatial distribution of flood producing areas with in watersheds .> The watershed of interest, was divided into seven subwatersheds which were digitally characterized in a geographic information system (GIS). Subwatersheds flood hydrographs associated with design rainfalls were determind using HMS model and were routed in the stream network to yield the total hydrograph at the outlet. With successively eliminating subwatersheds from the simulation process, in a method titled “Successive Single Subwatershed Elimination method"(SSSE), flood hydrograph at the outlet was determined so that the contribution of each subwatershed in the flood peak at the outlet could be quantified. The routing results show that this contribution is not only a function of subwatershed discharge and size but also a function of other factors (discharge sychoronization at the outlet). Thus, any flood control measure must consider the flood area prioritization in term of contribution at the outlet.> Also, for determine of effective factors, sensitivity analysis on watershed slope, stream slope and CN Was carried out. CN was identified as the most important factor as it can be easily altered in flood control project. Reduction of stream slope by 30% decreases the peak discharge by only 8%, while a l0% reduction in CN causes the peak to drop by 21%.
Keyword: Flood producing potential, priority, sensitivity analysis, subwatershed, HMS model, GIS.

Tuesday, July 18, 2006

Delineating desert domains using geomorphoclimatological factors

KHOSROSHAHI, Mohammad
Research Institute of Forests and Rangelands.P.O Box 13185-116 Tehran, IranEmail: khosro@rifr-ac.ir

ABSTRACT
Desert and desertification is one of the climate change and human activities causes. however;desert areas are increasing yearly duo to these two factors, but currently the extent of desert areas has not been recognition based on a proper and scientific criteria. Usually some natural factors (like climatology, geomorphology, geology, hydrology, vegetation cover and soil) are effective in determination of domain desert areas. In this paper we conducted to identify desert regions from nonedesert based on some suitable climatology and geomorphologic parameters in Tehran province
First, informational layers of each criterion were determined. For example, related to climatology factor, annual precipitation, coefficient of variation, irregularity factor of precipitation, daily mean intensity, range of absolute monthly and yearly temperature, evaporation were considered. For geomorphology indicators such as; pediment, salt lake, sand dunes, nebkha, reg, badland, yardang and….were determined. These indices for all factors were assessed as description of research methodology. Supply of numeral maps in GIS for each factor showed, there are different area from 9.3, and 16.1% for climatology and geomorphology factors respectively in Tehran province. Overlaying factors showed that; there are different areas of desert from each factor. Meant the region that one of factors introduces it as desert, The other didn’t know it as desert. Thus for Delineating and separating of desert and non-desert areas we can't use only one factor. We must use all of factors for separating desert area. The regions have more desert factor have more bio- environment difficulty.
Key word: desert, climatology, geomorphology, GIS, Tehran province.

Wednesday, May 10, 2006

Development of a new method for recognition of Iran deserts based on climatological criteria

Mohamad khosroshahi :Research institute of forest and rangelands. Tehran. Iran. P.O.box:13185-116, Email: khosro@rifr-ac.ir http://khosromk.blogfa.com
Majid hosseini: research center of natural resources, Tehran, Iran. Mjhosseini@hotmail.com
Aziz karami: research center of natural resources, Tehran, Iran.


Abstract:

Desert and desertification is one of the climate change causes. Usually;desert areas are increasing yearly duo to climate change and human activities. Currently the extent of desert areas has not been recognition based on a proper and scientific criteria .
In this paper we conducted to identify desert regions from nonedesert based on some suitable climatological parameters in Tehran province. In order to carry out this project, we selected 34 meteorological stations in Tehran province and their spatial distribution were determined using GIS technology. The climatological indices used to segregate desert from nonedesert were;precipitation rate, coefficient of variation, daily mean intensity & irregularity factor of precipitation and mean temperature & evaporation. For each climatological index we prepared an isomap using mentioned criteria. Interface between mountainous and plain was selected as base line index in separate desert from nonedesert area. The 6 different layers were overlaid and compared with natural physiography of land. The final map make it possible to identify a strip boundary located in that interface, between plain and mountain. It is concluded that, regions based on this strip, three zones were formed, which called desert(inside zone), semidesert(middle zone) and nonedesert(outside zone). In semidesert area climatological characteristics were common both with two others regions located both side of boundary strip.

Key word:desert, desertification, climatology, climate change, GIS, Tehran province.

Tuesday, April 11, 2006

The role of flood routing in determination & separaration of flood-generated regions in watershed

Mohammad Khosroshahi [1] Bahram Saghafian[2]

[1] -Research Institute of Forests and Rangelands. P.O.Box 13185-116,Tehran, I. R. Iran.
Email:
khosro@rifr-ac.ir
[2]- Soil Conservation and Watershed Management Res.Cen.P.O.Box 13445-1136,Tehran, Iran.
Email :
saghafian@scwmrc.com

Abstract

Most areas in the country are subject to frequent flood damages in term of increasing loss of lives and properties. Considering the direct and indirect consequences of flood in economic terms, high priority must be given to flood studies. In this regard, areas with high flood potential must be identified. Since climatic factors may not be altered, flood prevention measures should be sought on the ground. Thus, watershed areas with high runoff potential are to be determined. Existing methods have considered the watershed as a lumped unit, focusing on regional or approximate analysis. In limited reported cases, the hydrologic response has been assumed linear and no hydrograph syncronization and attenuation due to stream routing have been taken into account.
This article presents a methodology, based on the use of mathematical hydrologic models and the interaction of effective factors, to study the spatial distribution of flood potential areas in watersheds. The flood potential index can be determined in the context of hydrologic response units.
The watershed of interest, Damavand, was divided into seven subwatersheds which were digitally characterized in a geographic information system(GIS). Subwatersheds flood hydrographs associated with various design rainfalls were determind using HMS model and were subsequently routed in the stream network to yield the total hydrograph at the outlet. With suceessively eliminating subwatersheds from the simulation process, in a method titled “successive single subwatershed elimination method", flood hydrograph at the outlet was determined so that the contribution of each subwatershed in the flood peak at the outlet could be quantified. Then, all subwatersheds were ranked with respect to the order of contribution to the outlet flood peak. The routing results show that this contribution is not only a function of subwatershed discharge and size but also a function of other factors. Another words, nonlinear response is obvios. Thus, any flood control measure must consider the flood spatial prioritization in term of contribution at the outlet.
The methods outlined in this article is believed to enable the flood potential zonation. Execution of the methods is strongly recommended in flood studies.
Keyword: Flood potential zonation, Flood control, priority, Spatial flood generation, HMS model, GIS, Damavand basin.

Saturday, March 18, 2006

Unit Response Approach for Priority Determination of Flood Source Areas

J. Hydrologic Engrg., Volume 10, Issue 4, pp. 270-277 (July/August 2005)

Bahram Saghafian1 and Mohammad Khosroshahi2

1Research Hydrologist, Soil Conservation and Watershed Management Research Institute, P.O. Box 13445-1136, Tehran, Iran (corresponding author). E-mail: saghafian@scwmri.ac.ir
2Research Geographer, Research Institute of Forest and Rangeland, P.O. Box 13185-116, Tehran, Iran. E-mail: khosro@rifr-ac.org
(Accepted 8 June 2004)

Flood damages are usually concentrated along certain reaches of the main watercourse. However, a successful flood-control project must look beyond the damaged reaches by studying the contribution of headwater subwatersheds to the flood magnitude at downstream locations. Flood-control measures may then be initially planned in identified flood tributary areas of the watershed that strongly affect the flood peak at downstream river reaches. A simple iterative simulation technique is introduced, whereby the contribution of each subwatershed unit or group of subwatershed units to the flood peak response can be disaggregated. A flood index may then be assigned to each contributing unit to determine the change in response of outlet flood discharge caused by removal of that unit. The technique is similar to the unit response approach in groundwater studies. The proposed technique is applied to a watershed; and the effect of such different factors as design return period, storm duration, and size of the contributing subunits are examined. The interpretation of results is based particularly on the flood index corresponding to the contribution at the outlet per unit area of subwatersheds. For the watershed under study, the flood index analysis showed that while the differences in the contribution of subwatershed units may be salient for up to 100-year return periods, the contribution per unit area is expected to converge for rare floods. Moreover, subwatershed units that have larger area or that are nearer to the outlet may not necessarily generate higher flood contributions.

©2005 ASCE
doi:10.1061/(ASCE)1084-0699(2005)10:4(270)
Additional Information

Tuesday, March 07, 2006

Desert control methods in Iran

Stabilizing the shifting sand dunes Methods in Iran are:

•Biochemical method
•Biomechanical method
•Biological method


•Biochemical method
In this method, the first spraying the petroleum is used for stabilizing the shifting sand dunes by the tanks that are equipped with strong pumps,


For seeding, Before spraying petroleum mulch we should seed near to raining season and then create a suitable cover on seeds.
•For seedling, we can do planting before and after spraying mulch. The selective trees should be compatible with ecological conditions.


Characteristics of petroleum mulch:

1) For the agriculture production should be harmless.2) Don’t injure hygienic the persons that spray petroleum mulch.3) Don’t remain unfavorable effects during ploughing and mixing the mulch and soil.4) Don’t have the unfavorable smell.5) Prevent from cracking the land and accelerate the sprouting.6) The air and rain can penetrate into it.


Biomechanical method

In this method, With creation of wind breaks on sand dunes and planting of seedling, prevent from shifting sand dunes and theirs detriments


Biological Method

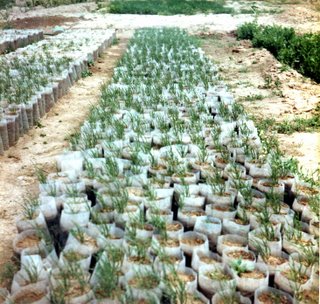
In this method, The plants for plantation of seedlings are produced in stations of shifting sand dunes stabilization. These trees are sowed in mentioned regions in winter or at first are grown in plastic vases and then are transferred to original lands. Seeding is one of actions for stabilizing the shifting sand dunes. Yearly a lots of seed are gathered from artificial forests in desert .They are showed in another areas, suit helps to develop the vegetation covers in another regions.


Combating desertification objectives

•Protection of environment

•Stabilization of shifting sand dunes
•Protection and rehabilitation of farm lands
•Conservation of water resources
•Protection of roads and communication networks
•Sustainable reclamation of human settlements

Monday, March 06, 2006

Causes of desertification in Iran

Some causes of desertification in Iran are:

•Population growth:
The population of the country has doubled during the last 20 years and naturally the demand for agricultural and animal products have been increased proportionally to the rate of increase. Thus people were forced to increase the number of their livestock and to use the lands more extensively. In order to increase the area of agricultural lands, people converted the rangelands and forests into farms and croplands. They also cultivated marginal lands for rainfed crops without any consideration of their inherent potentials. These activities in many cases have resulted in desertification.


•Increase in the number of livestock:
Increasing demand for dairy products during recent years has caused the increase in the number of livestock. In addition to overgrazing due to excessive livestock numbers, most of the rangelands experienced untimely grazing in the forms of early grazing or late grazing


•Converting forests &rangelands into farmlands and increase of dry farming:
In the last decades extensive areas of rangelands located on the mountainous regions and steep slopes plowed and converted to the croplands and dry farming as the demand for cereals had increased. Since these kind of lands was not suitable for the agricultural practices soon after changed to a degraded land with very low productivity. Finally because of low productivity the land were abandoned and led to desetification processes


•Uncontrolled use of agricultural machinery:
Villagers and farmers can now obtain farm machinery easily. Most of these imported equipment do not fit the conditions of arid and semi-arid lands of Iran. These machinery not only let them much more extensive operations than traditional ones, but also are used to plow more rangelands and to cut more trees and bushes from the rangelands and forests.


•Fuelwood gathering:
Despite the fact that Islamic Republic of Iran is a rich country in oil well and oil industry, just a little portion of the villagers were able to use petroleum fuel before the Islamic revolution in 1979. In addition to the demand for fuel to meet household cooking and heating needs. In addition to the traditional fuel gathering some factories are also using fuelwoods.


•Refugees settlement:
During civil var. in Afghanistan both when Taliban governed and also during conflict between former Soviet and Mojahedin, many Afghan people left their country and settled in Iran and Pakistan as refugee. In Iran most of these refugees settled in the eastern part of Iran particularly in Khorasan and Systan Provinces. Excessive pressure exerted on land due to refugees activities to meet their requirement and demand for fuelwood caused more than 1.2 million hectares of lands being degraded.


•Overexploitation of water table and mismanagement of irrigation:
Overexploitation of ground water reserves for expansion of agricultural lands caused water table to drop to a critical level almost in the whole central plateau. As drought years persist, ground water table increasingly reused by stakeholders to meet their requirements in terms of irrigation and other needs. Since water table is not replenished in drought periods, thus resulted in aquifer deterioration and leads to land abundance. These processes finally resulted in desertification.


Features in Desert Areas of Iran

•Sand accumulation and formation of sand dunes are important features in inland and coastal deserts, which are considered critical problems. There are presently about 26 large-scale ergs, which have covered 120,000 square kilometers of deserts in Iran. It is noteworthy that the most important citadel of the world (Lout) is located in Iranian desert with pyramids of more than 500 meters height. Totally, Iran covers 5 million hectares of active sand dunes.


Nebka


•Nebkas are formed where wind erosion persists. It includes regions where sediments gathered around bushes. In this case, bushes gradually go upward until roots are disconnected from underground water and bushes will die.


(Nebka, yazd-Iran)


Kalout and Yardang:

Another feature in desertified lands is Kalout and Yardang formation which is formed by wind and water erosions. Strong and lengthy raining causes the degradation of lands exposed to erosion and so soil particles will being removed and form Kalout and Yardang hills.

(Kalout, China-Cansu Province)


Salty and Clay Pans:

•These features could be seen in central lower areas (playas). The percentage of salt in these spots is very high which doesn’t let plant establish easily. These spots are barren, without any vegetation. A large portion of central Iran is covered by this phenomenon.

Dr.Mohammad , khosroshahi (Salty Kavir, Qom-Iran)

Deserts of Iran


Aristida pennata is a good species that growth well on sand dunes


Dr. Mohammad,Khosroshahi between the
two Aristida pennata on the sand dune hills (Nieshaboor,Iran)


Desert of Iran:

The word “desert” illustrates an ecosystem with special conditions. Factors such as climatic criteria as well as soil criteria including geology, geomorphology, and soil and also the vegetation and ecology play a role in formation of deserts and particularly in Iran.
•In Iran, there are two main groups deserts: coastal deserts and inland deserts,
Coastal deserts extend in a west-east strip, alongside the Sea of Oman and the Persian Gulf. humid winds in these deserts, have been their main distinguishing factors from inland deserts.
The inland deserts are located in the center, east and south east of Iran, Lout desert is one of the most famous in this group, and second, is Dashte Kavir. These deserts have a surface area of 34 million hectares.


Wednesday, March 01, 2006

Lecture in training course in Gansu Desert Control Research Institute- China,Wuwei

A Glance of desert /desertification and combating desertification in Iran
GDCRI, Agu-Sep,2004
Dr. Mohammad, khosroshahi , khosro@rifr-ac.ir
Research Institute of Forests and Rangelands ,Tehran- Iran


Climatology:


•Numerous mountains and vast plains have given rise to various ecological attributes in Iran. Because of this complex climate Iran is famed for having four distinct seasons at the same time. It is mild and wet in the north, cold and dry in the west, mild and dry to hot and dry in central regions; and hot in the south. Annual precipitation in desert regions is about 50 mm, while it is more than 2000 mm in some part of northern region.


Vegetation of Deserts:


In deserts of Iran there are more than 44 families of desert plants with different varieties and kinds, which survive through unsuitable ecological conditions; and further play an outstanding role in preservation of soil and water in deserts. Compositae and Chenopodiaceae are the most important families of the desert flora.


kinds of plants for reclamation of vegetation and combating wind erosion and for stabilization of shifting sand dunes.

•Haloxylon ammodendrom
•Haloxylon persicum
•Haloxylon aphyllum
•Atriplex lentiformis
•Atriplex halimus
•Atriplex canesence
•Acacia arabica
•Acacia modesta
•Calligonum turkestanicum
•Calligonum leucocladum
•Panicum miliaceum
•Panicum axtisotal
•Tamarix romossima
•Tamarix stricta
•Tamarix aphylla
•Eucalyptus Sp.
•Prosopis Sp.
•Aristida sp.